Setting Up VSCode for Python development
This tutorial will show you how to set up vscode for remote Python development, including debugging and recommended extensions.
Prerequisites
-
Follow the instructions on the VSCode on Cluster tutorial to start a remote VSCode session and connect to a job on the cluster.
-
Follow the instructions on the Using Conda tutorial to create a conda and set up a conda environment.
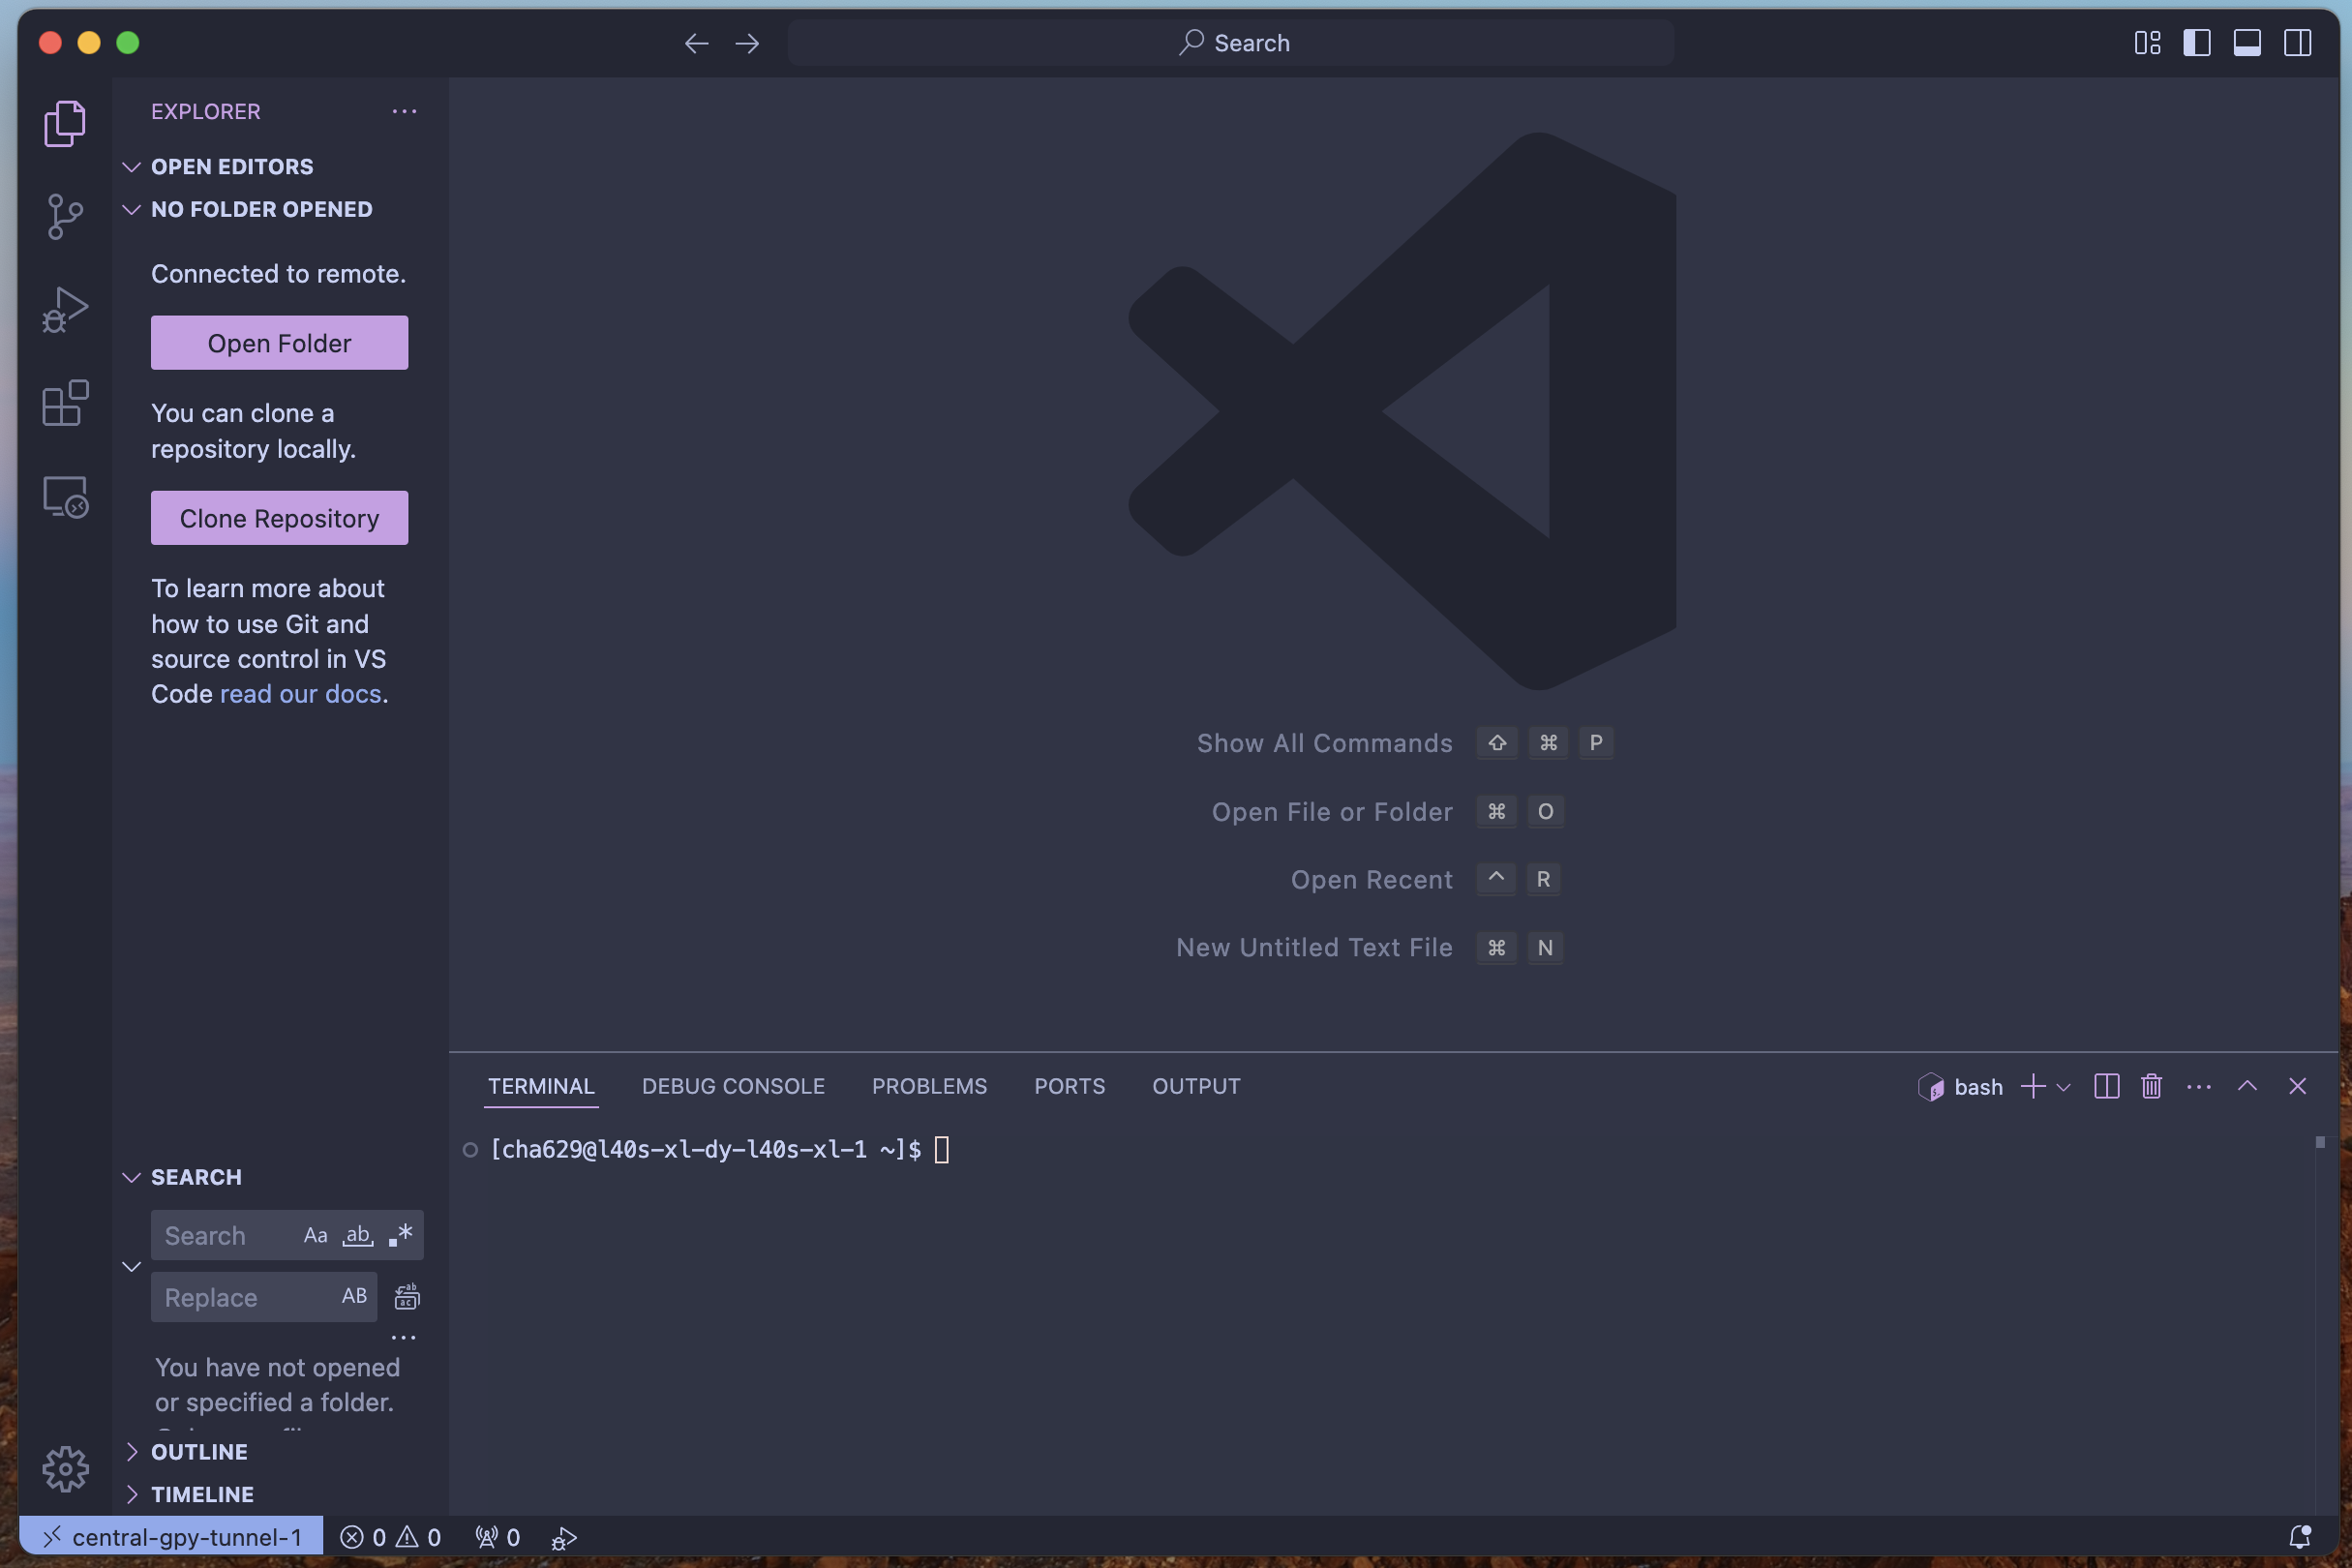
After opening VSCode on the cluster, it should look like this:
Configure VSCode
Open a folder for development
After launching VSCode and connecting to your tunnel, open a folder where you will do your development. Press CMD + SHIFT + P (on Mac) or CTRL + SHIFT + P (on Windows) to open the command pallate search bar. Type "File: Open Folder" and open a development folder.
This can be an existing project or a new folder. This will be the workspace where VSCode will look show you files, store local settings, etc.
Install the Python Extension
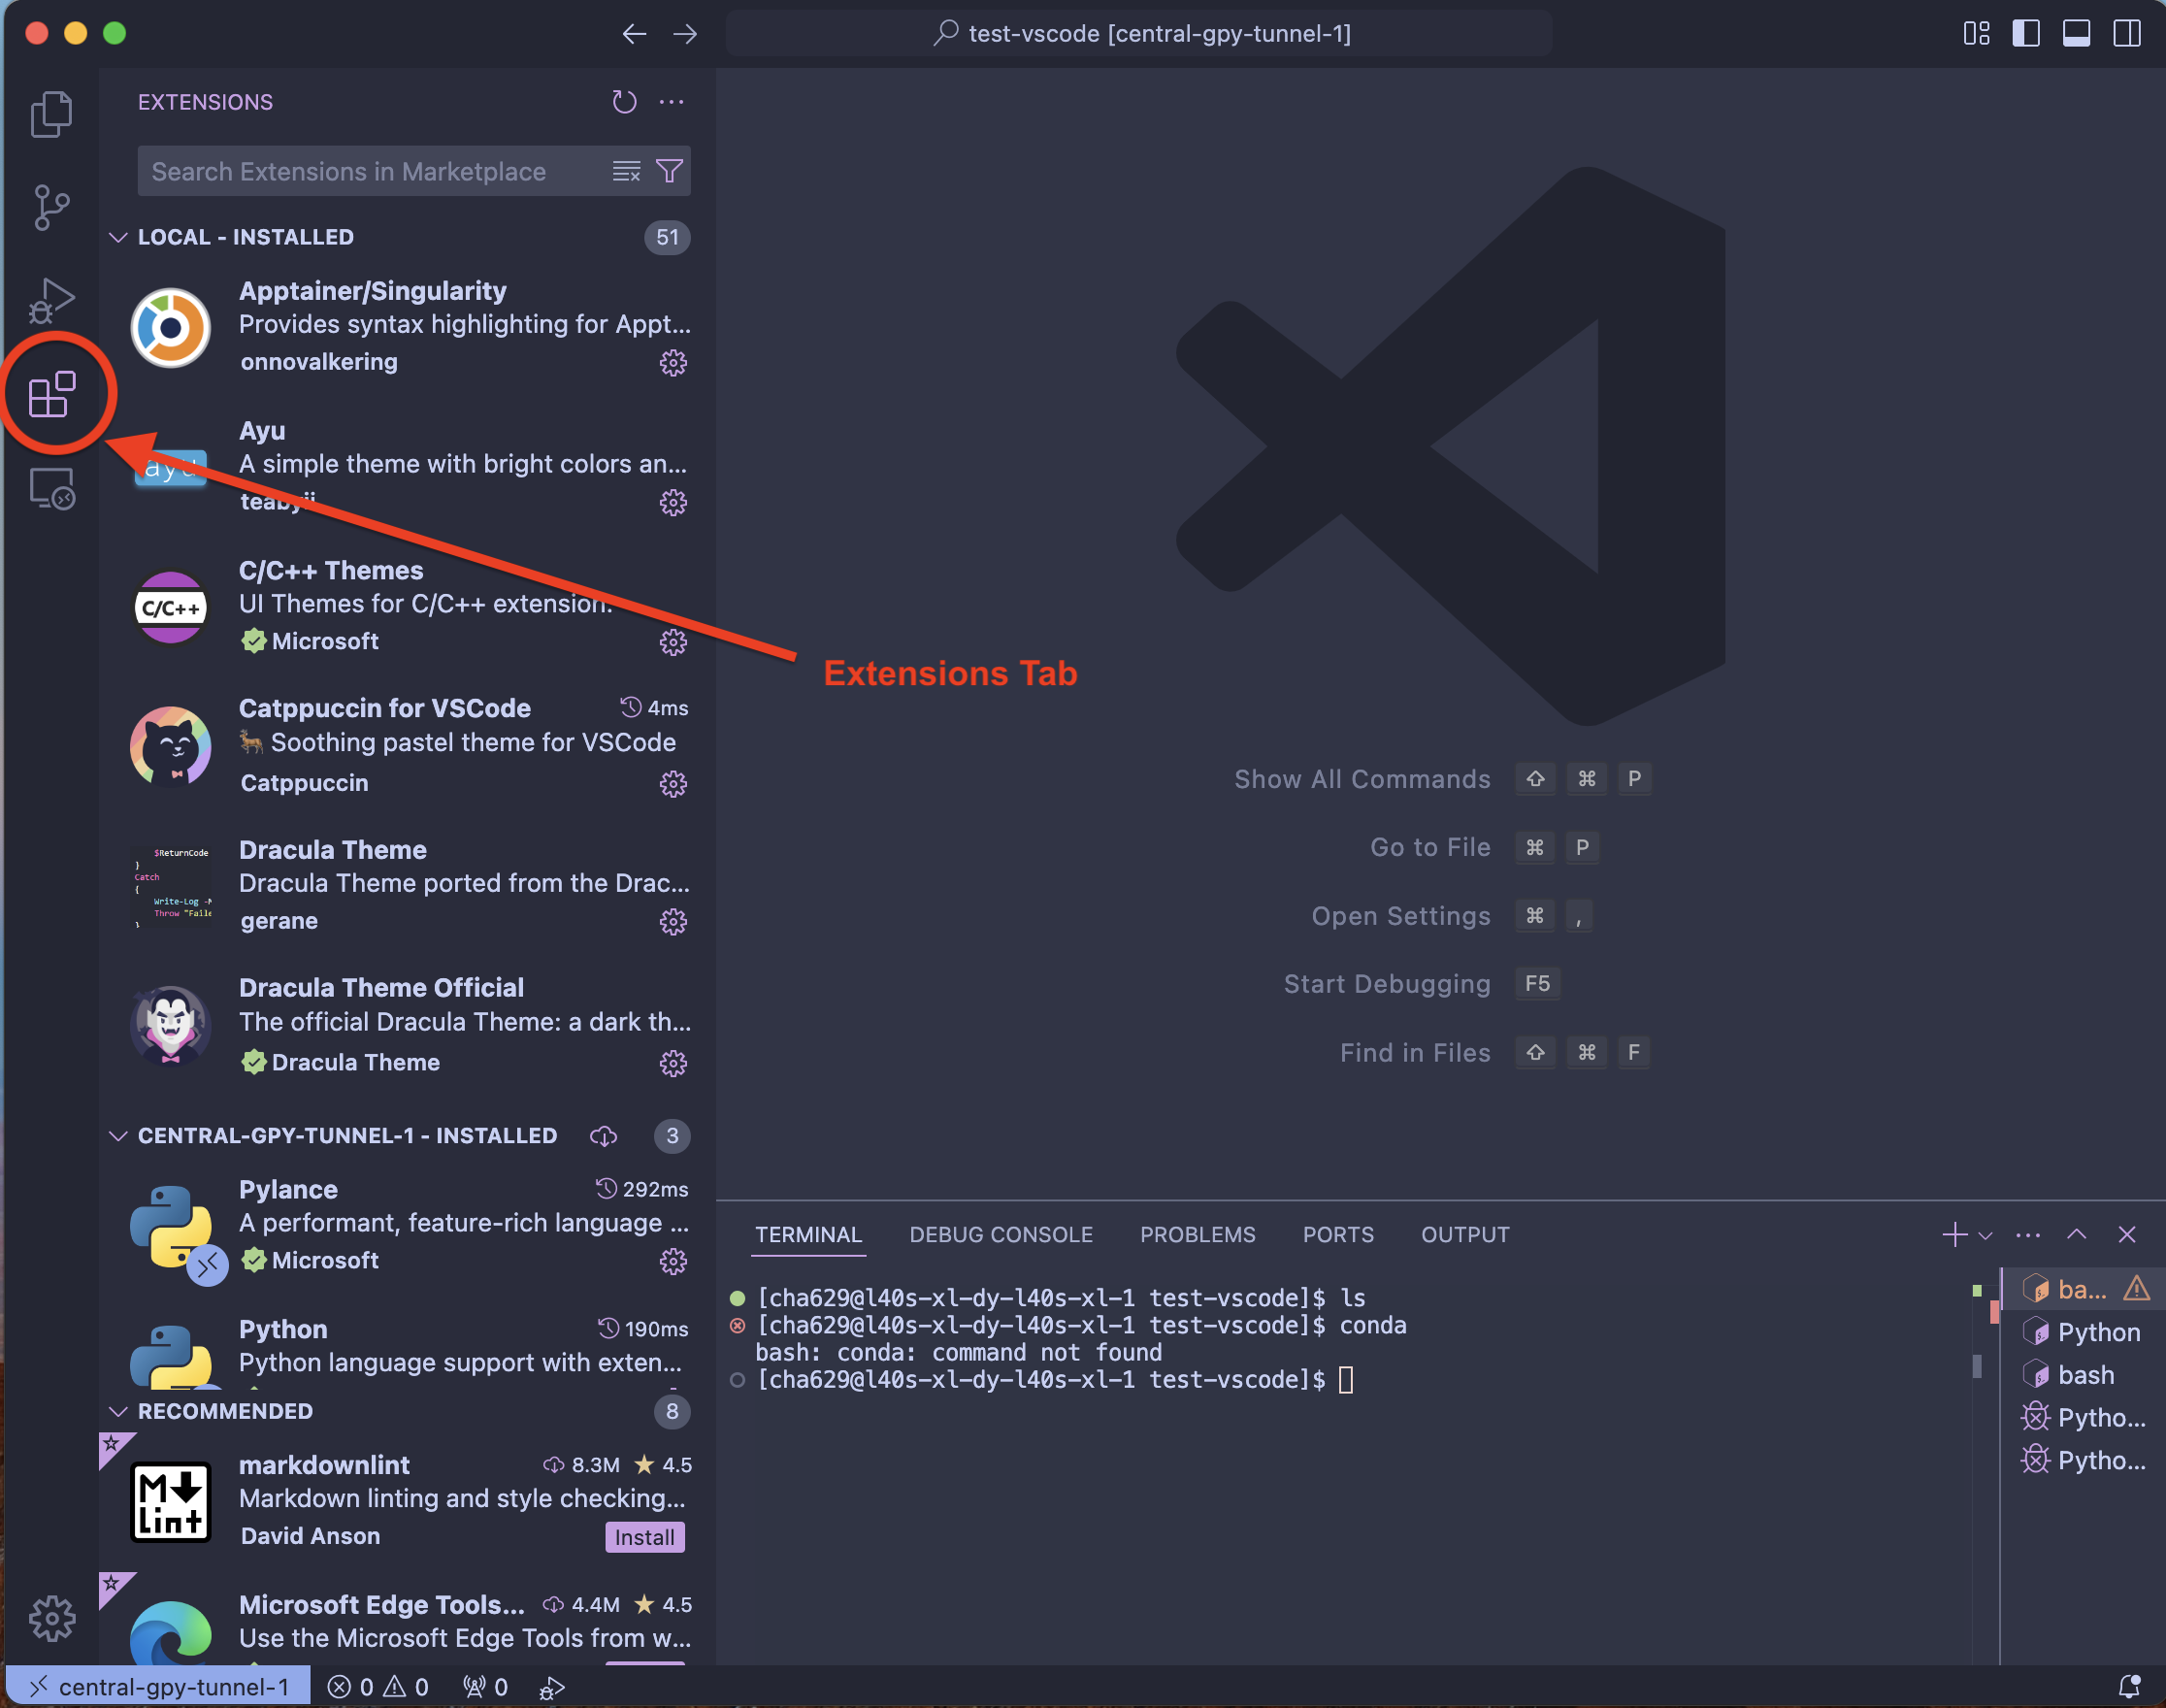
Click on the extensions tab on the left side of the window
Search for "Python" in the extensions list, and click "Install in [Central GPU Cluster]" or whatever the name of your tunnel is.
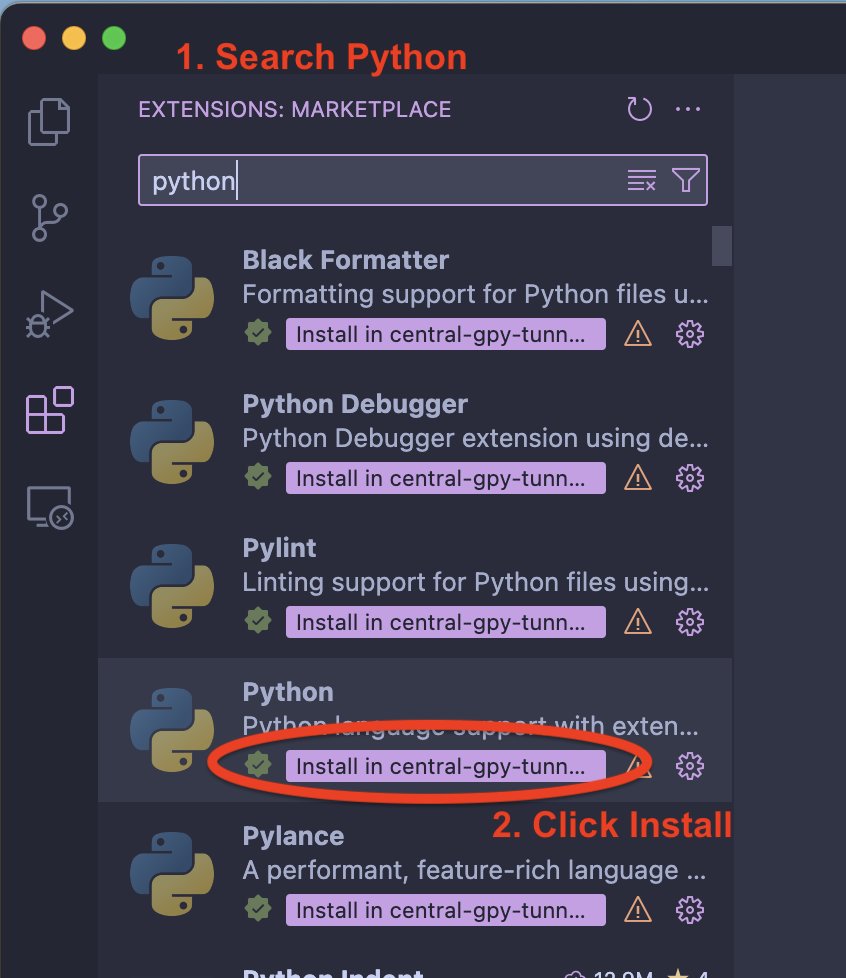
This extension will give you access to a Python language server tools such as debugging and intellisense, as well as tooling to run and debug Python code from VSCode.
Configure Conda Settings
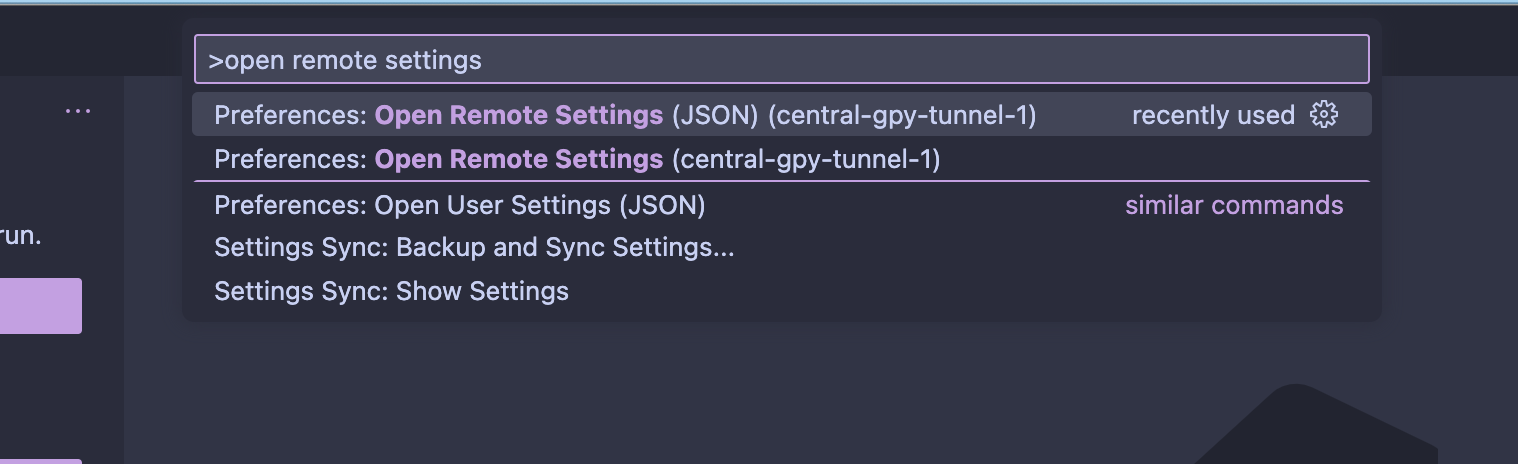
Open the command palatte, and type: Open Remote Settings (JSON). Select the first option.
You should see a (likely empty) JSON file. Add the entry:
{
    "python.condaPath": "/shared/software/software-environments/miniconda3/bin/conda",
}
Select Python Interpreter
Open the command palatte and type: "Python: Select Interpreter"
You should see a list of conda environments and Python runtimes. Select the conda environment that you created.
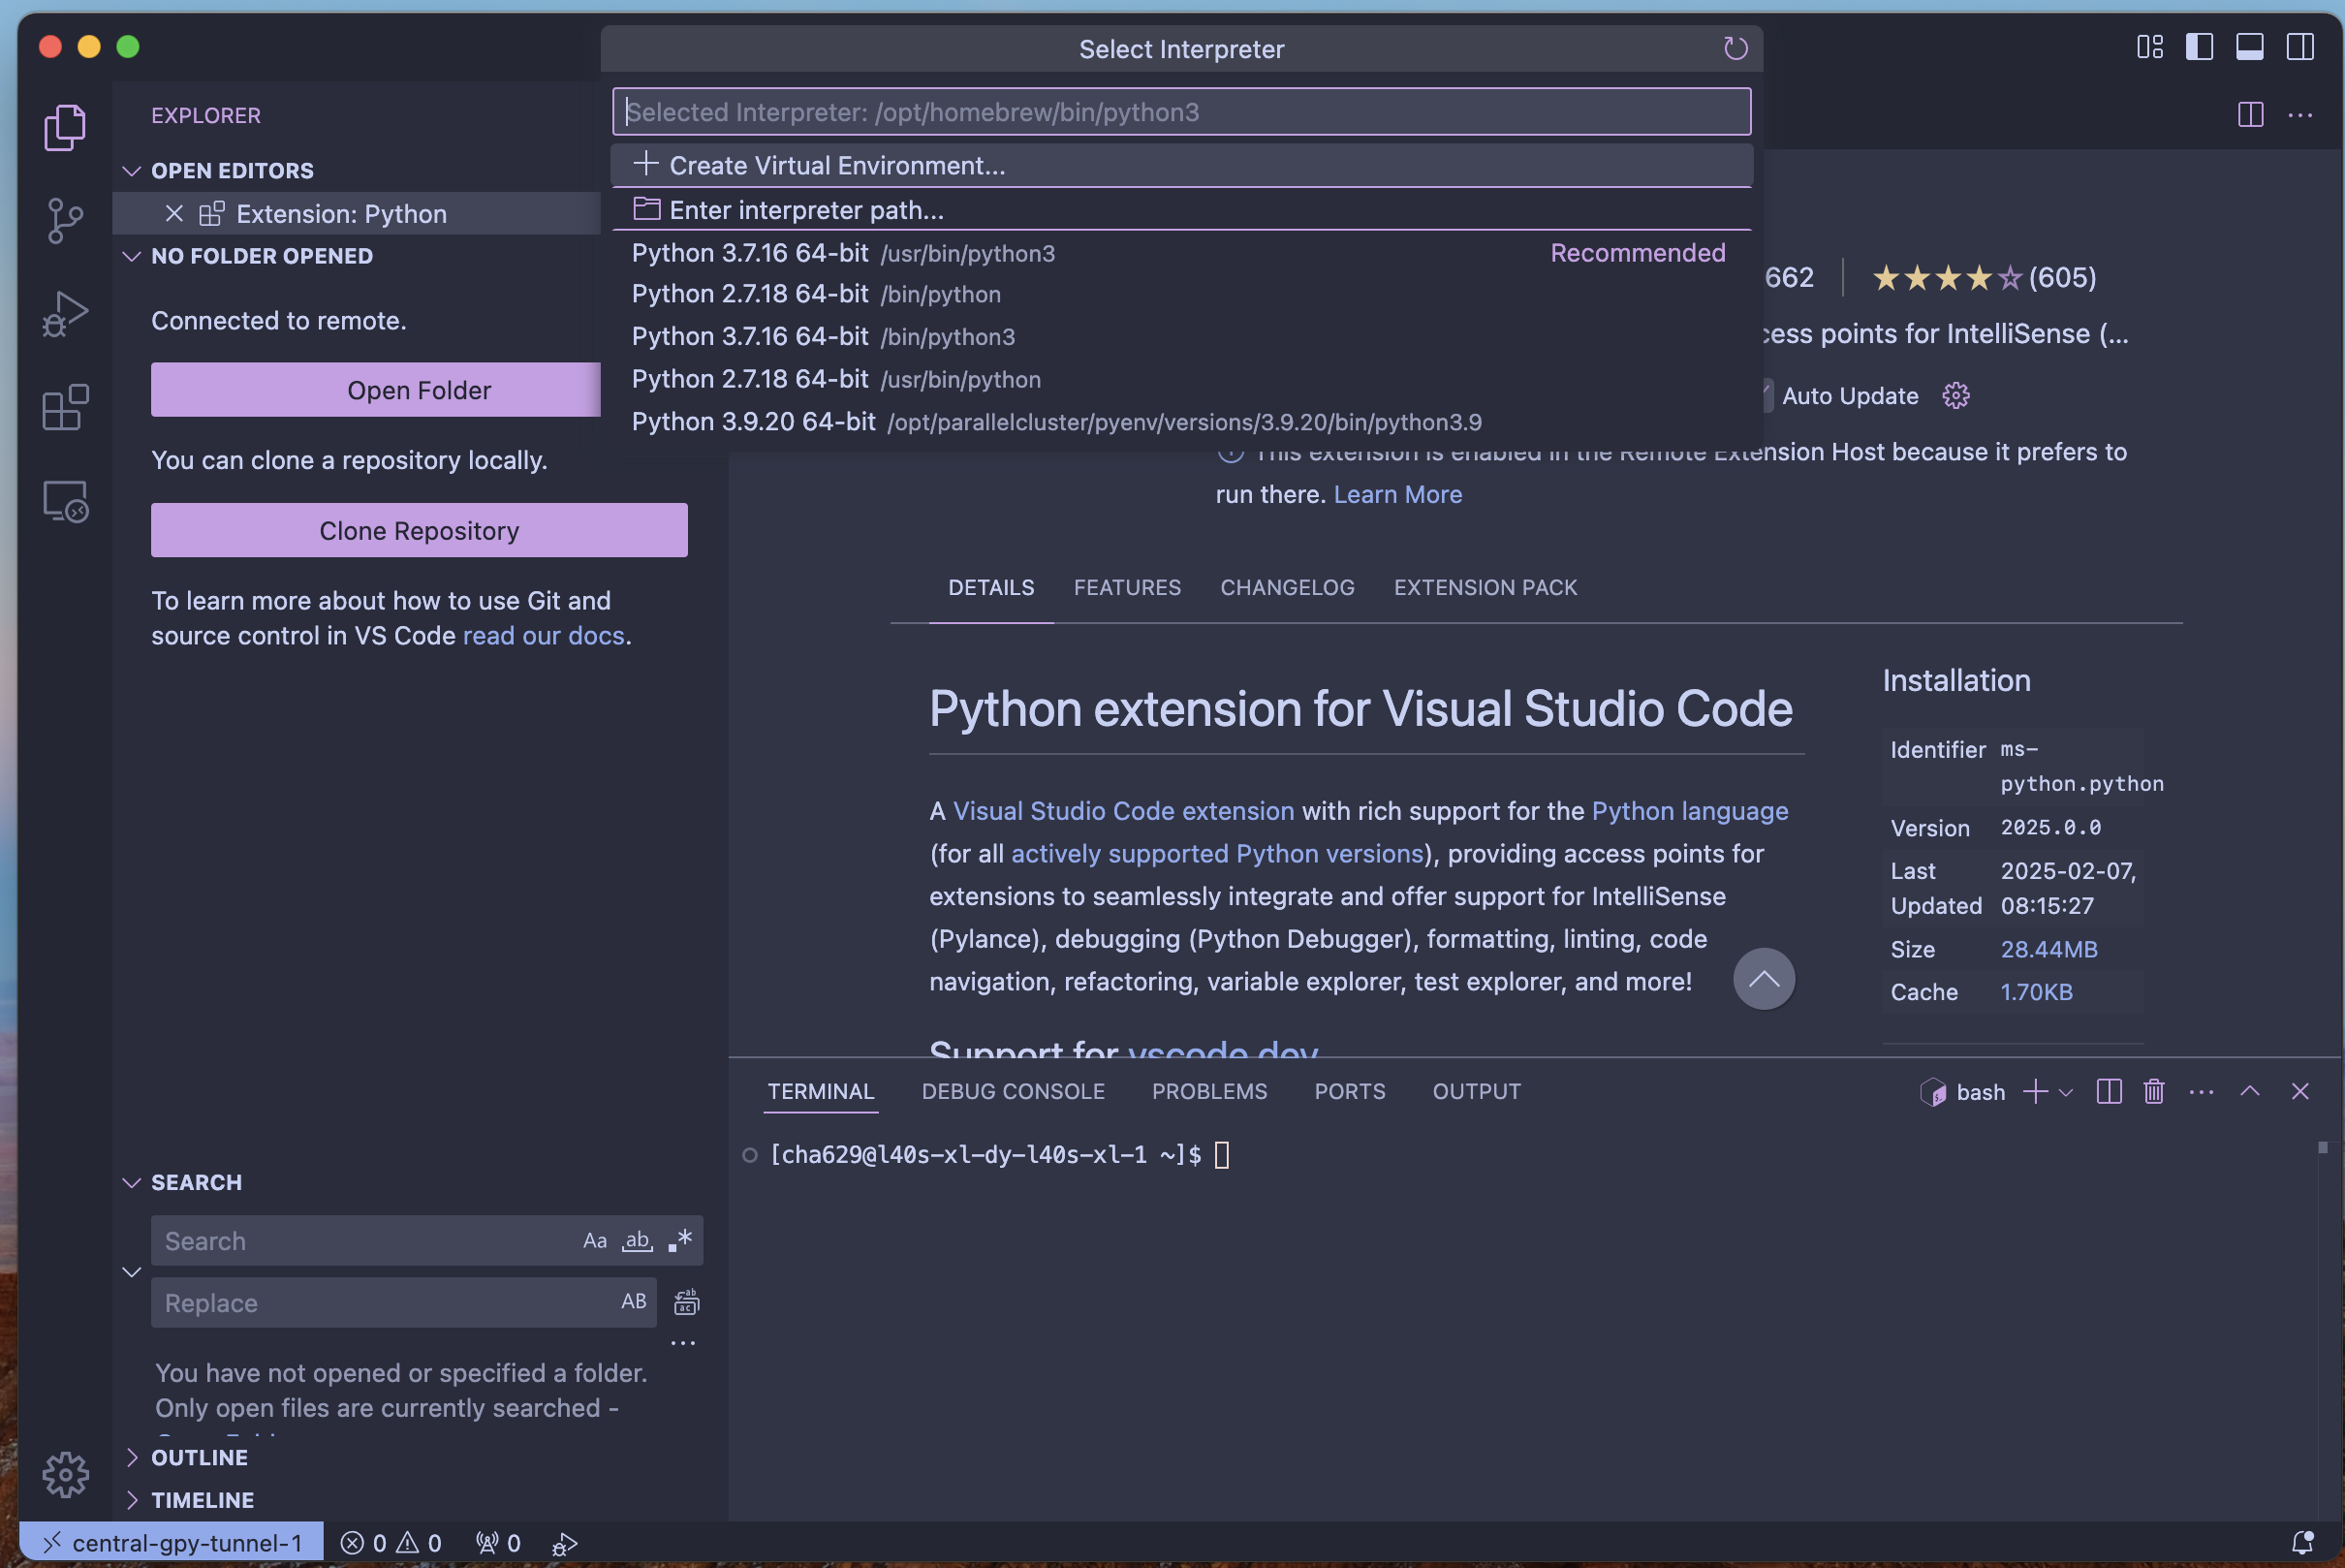
If you don't see your environment listed, it means VSCode does not know where to find it. Do the following steps:
-
Find the location of your conda environment. Activate the conda environment in a terminal, and type
echo $CONDA_PREFIX. Copy the returned value to your clipboard. -
Open the command palatte and type "Python: Select Interpreter". Select "Enter Interpreter Path" instead of a specific Python environment.
-
Paste the CONDA PREFIX path, and press enter
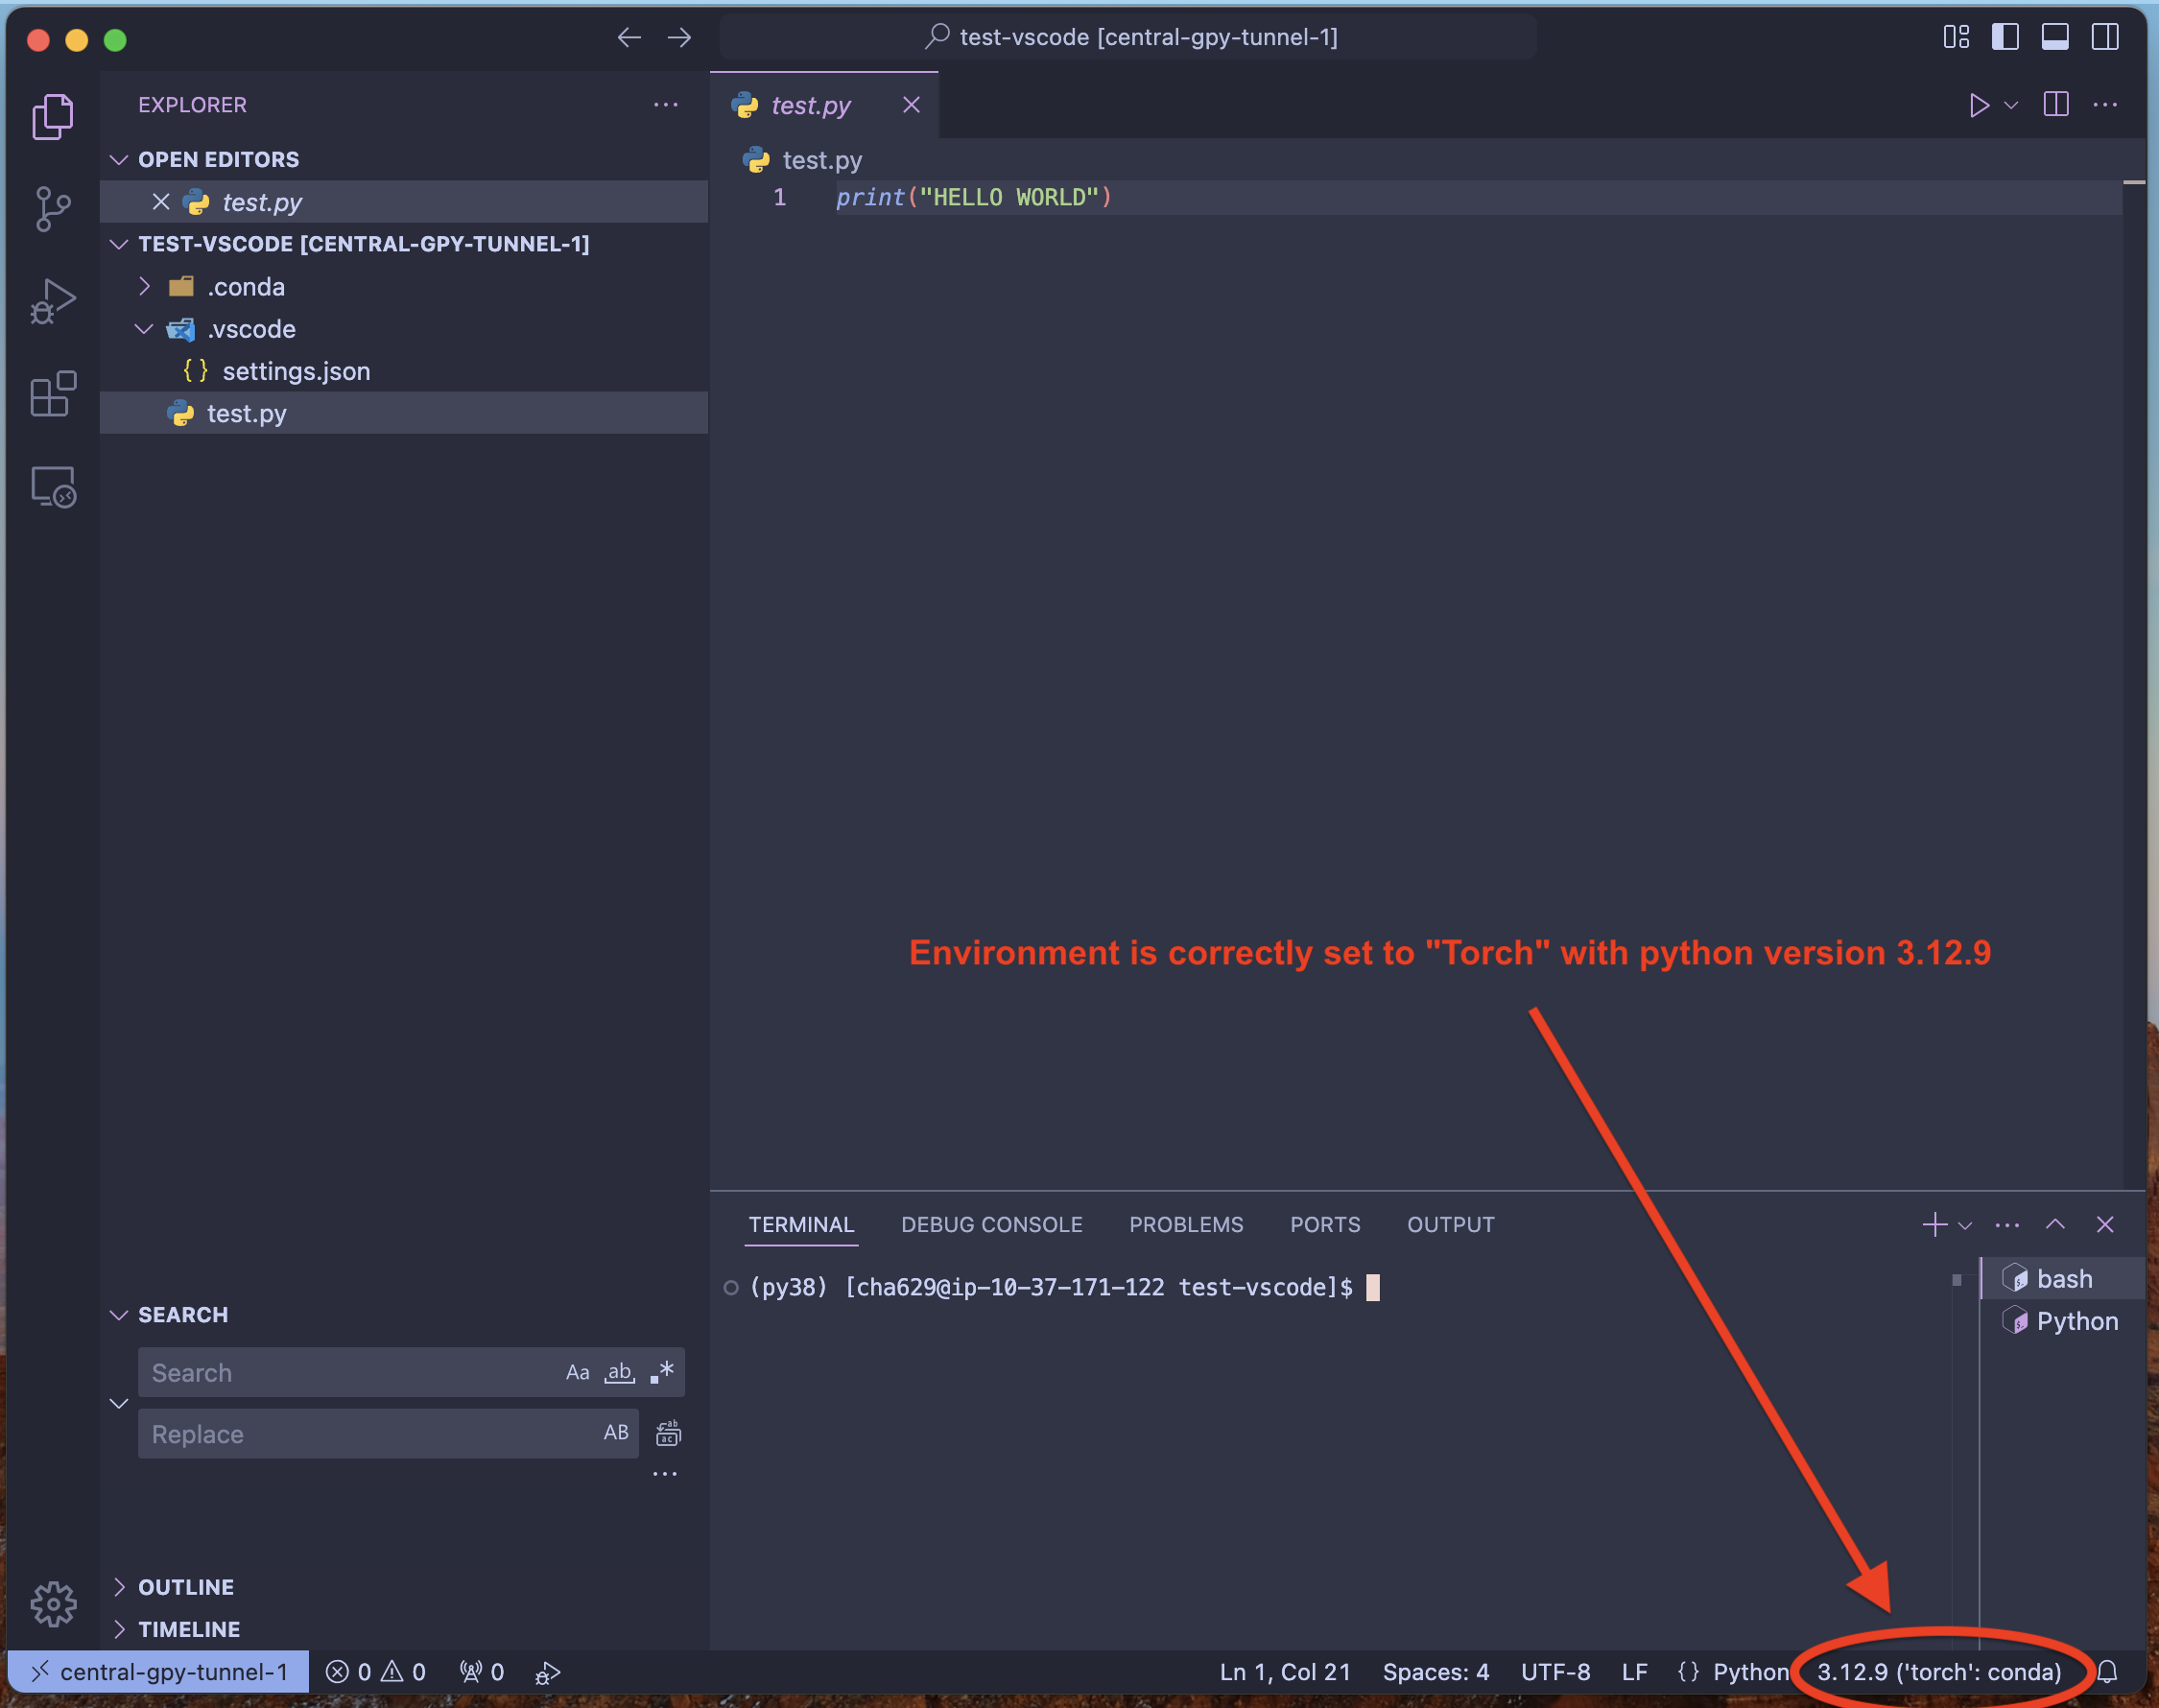
If you have set the environment properly, VSCode should display the environment name and Python version in the bottom right corner.
Run Python code
If you have correctly set up VSCode on Cluster tutorial, you should be running within a compute node on the cluster. You can check this by openeing a VSCode terminal (Press: CTRL + BACKTICK) and running echo $SLURM_JOB_ID. If the command does not output a number, then you are running on a login node.
[!WARNING] Do not run code on a login node as this will slow down the server for everyone. Please follow the instructions on the VSCode on Cluster tutorial to allocate a compoute node before starting VSCode.
To run the current Python file in a VSCode terminal, click the Play icon in the top right corner (see image below).
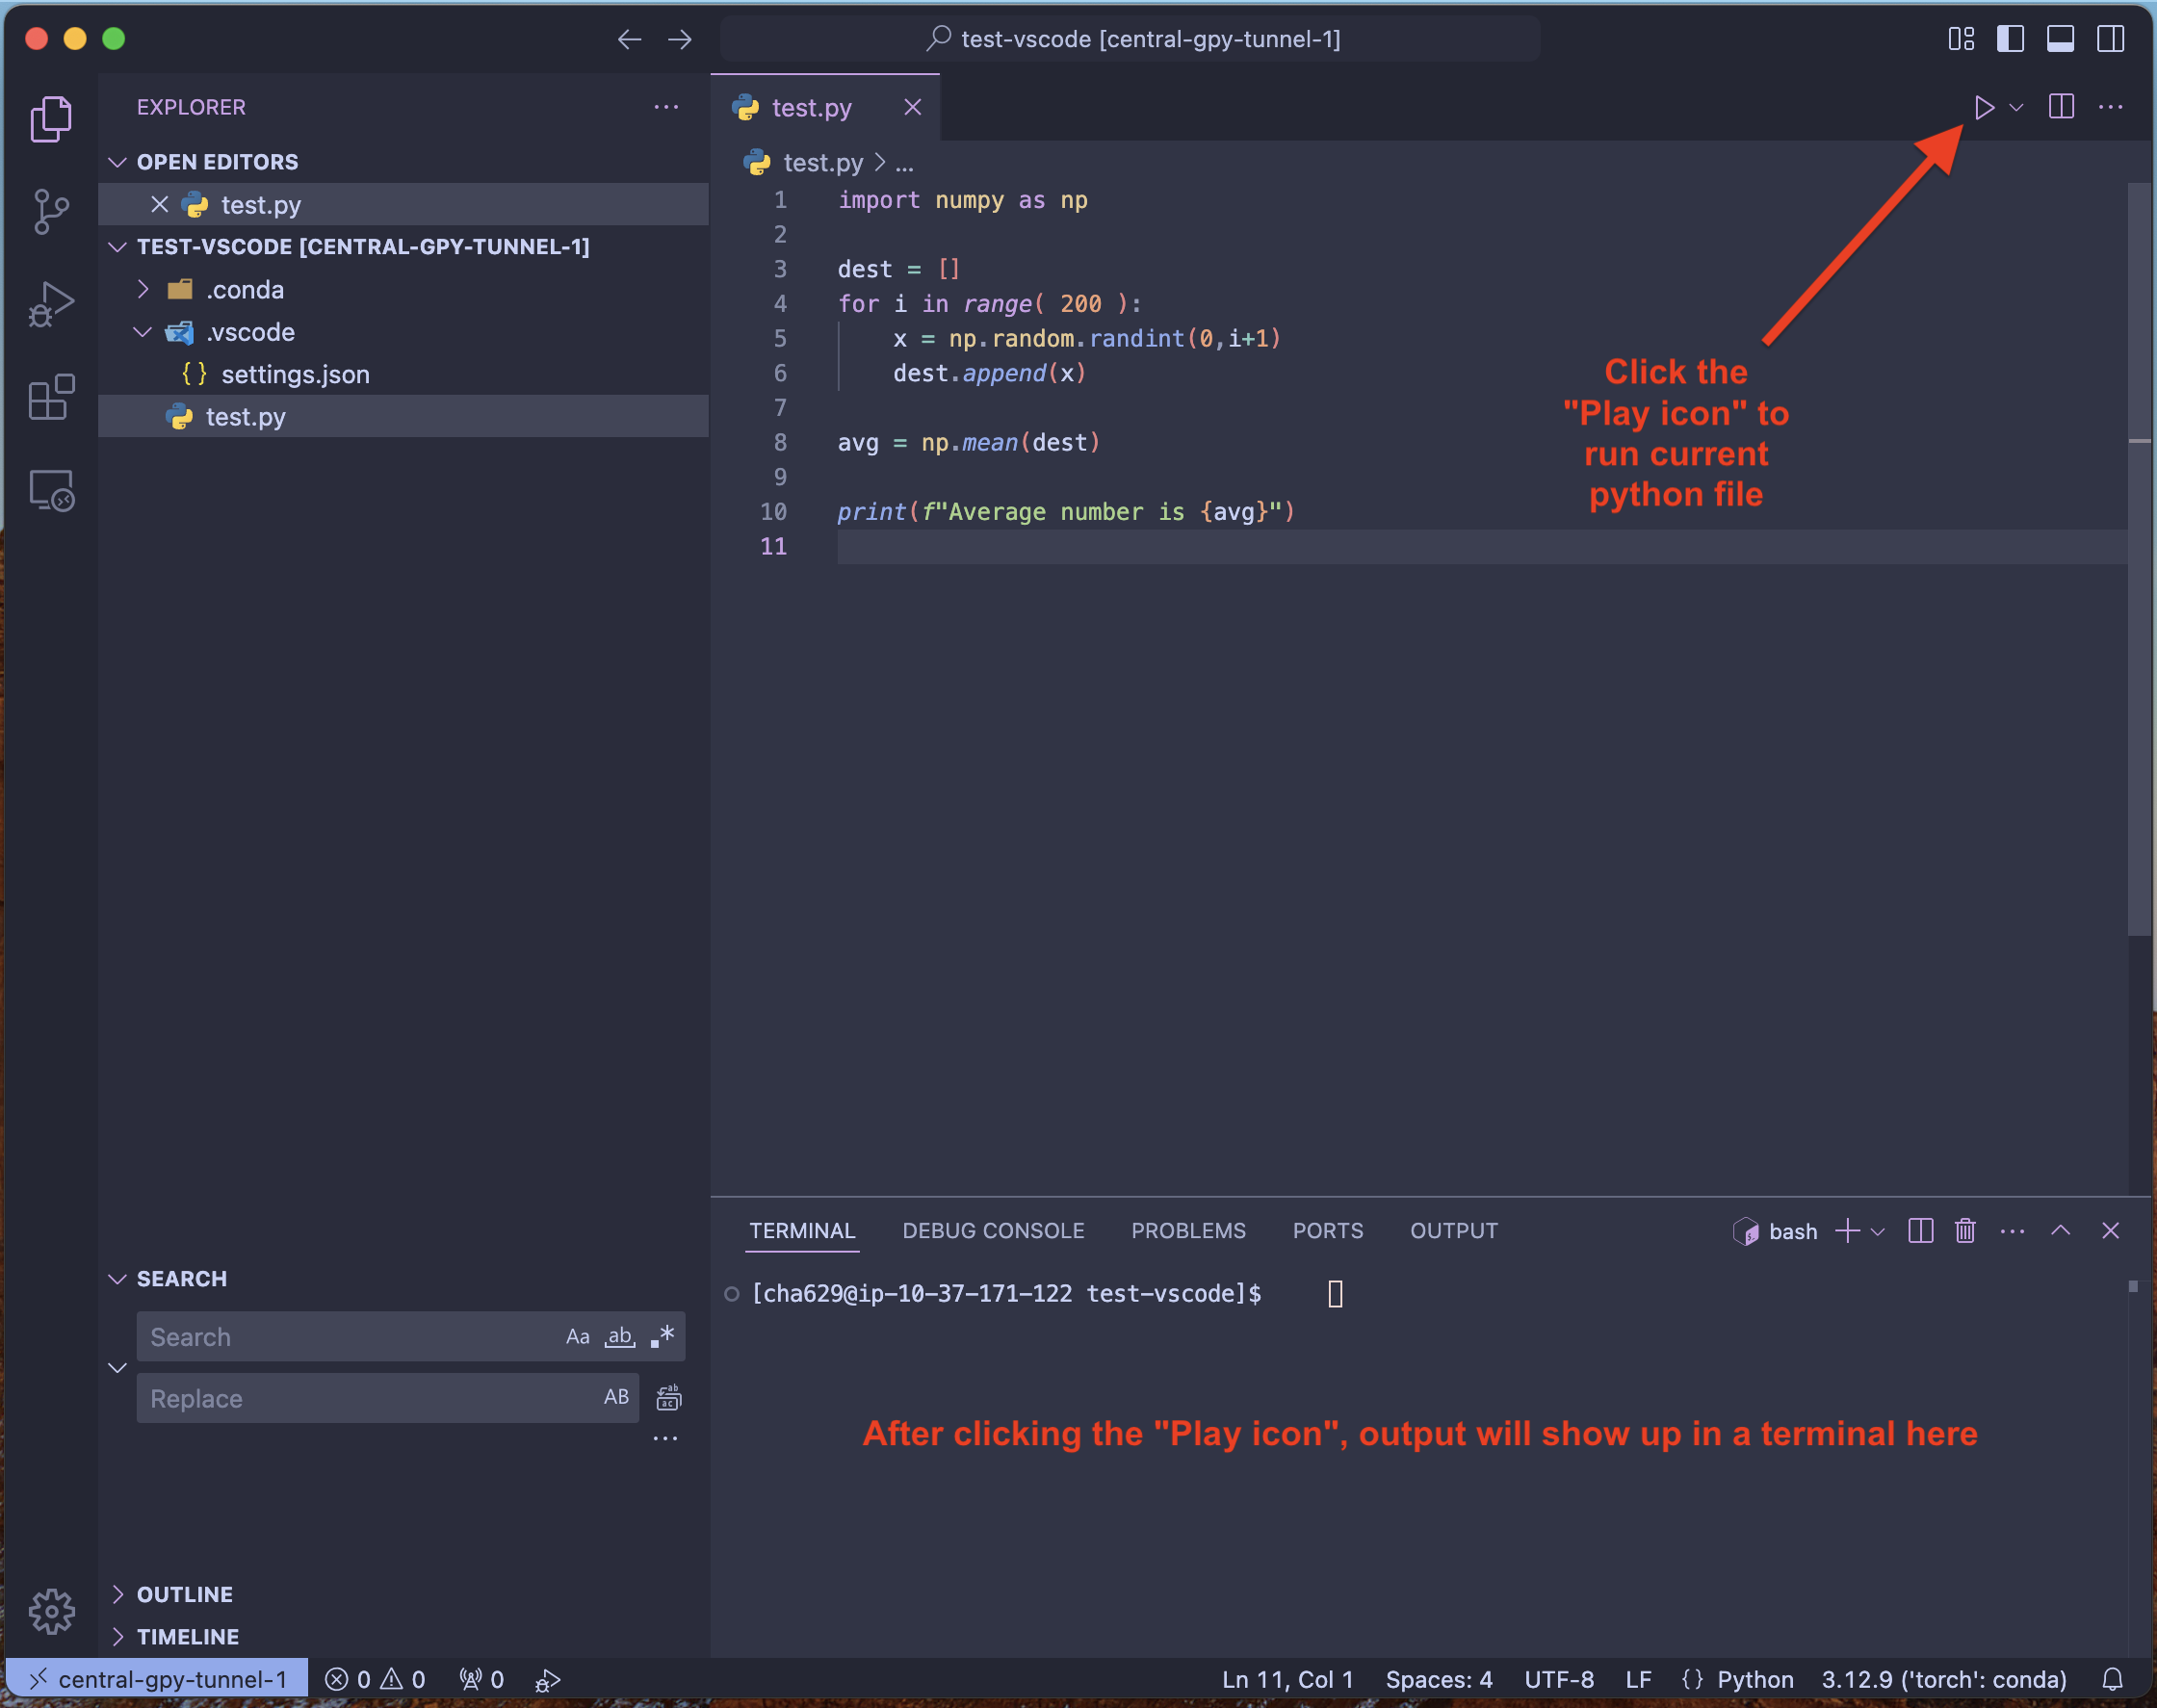
This will execute the current Python file using your selected conda environment, and print the output to a terminal at the bottom of the screen.
Open Python REPL
To start Python REPL (Read, Evaluate, Print, Loop) i.e. an interactive Python shell like you obtain by running the Python command, open the command palatte and type: "Python: Start Terminal REPL".
This will open a REPL environemt in a terminal at the bottom of your screen. It will use the selected conda environment, so you do not have to manually source or activate conda.
Debug Python code
Using the VSCode debugger, you can stop code execution at specific lines and inspect variables. See image below for more details.
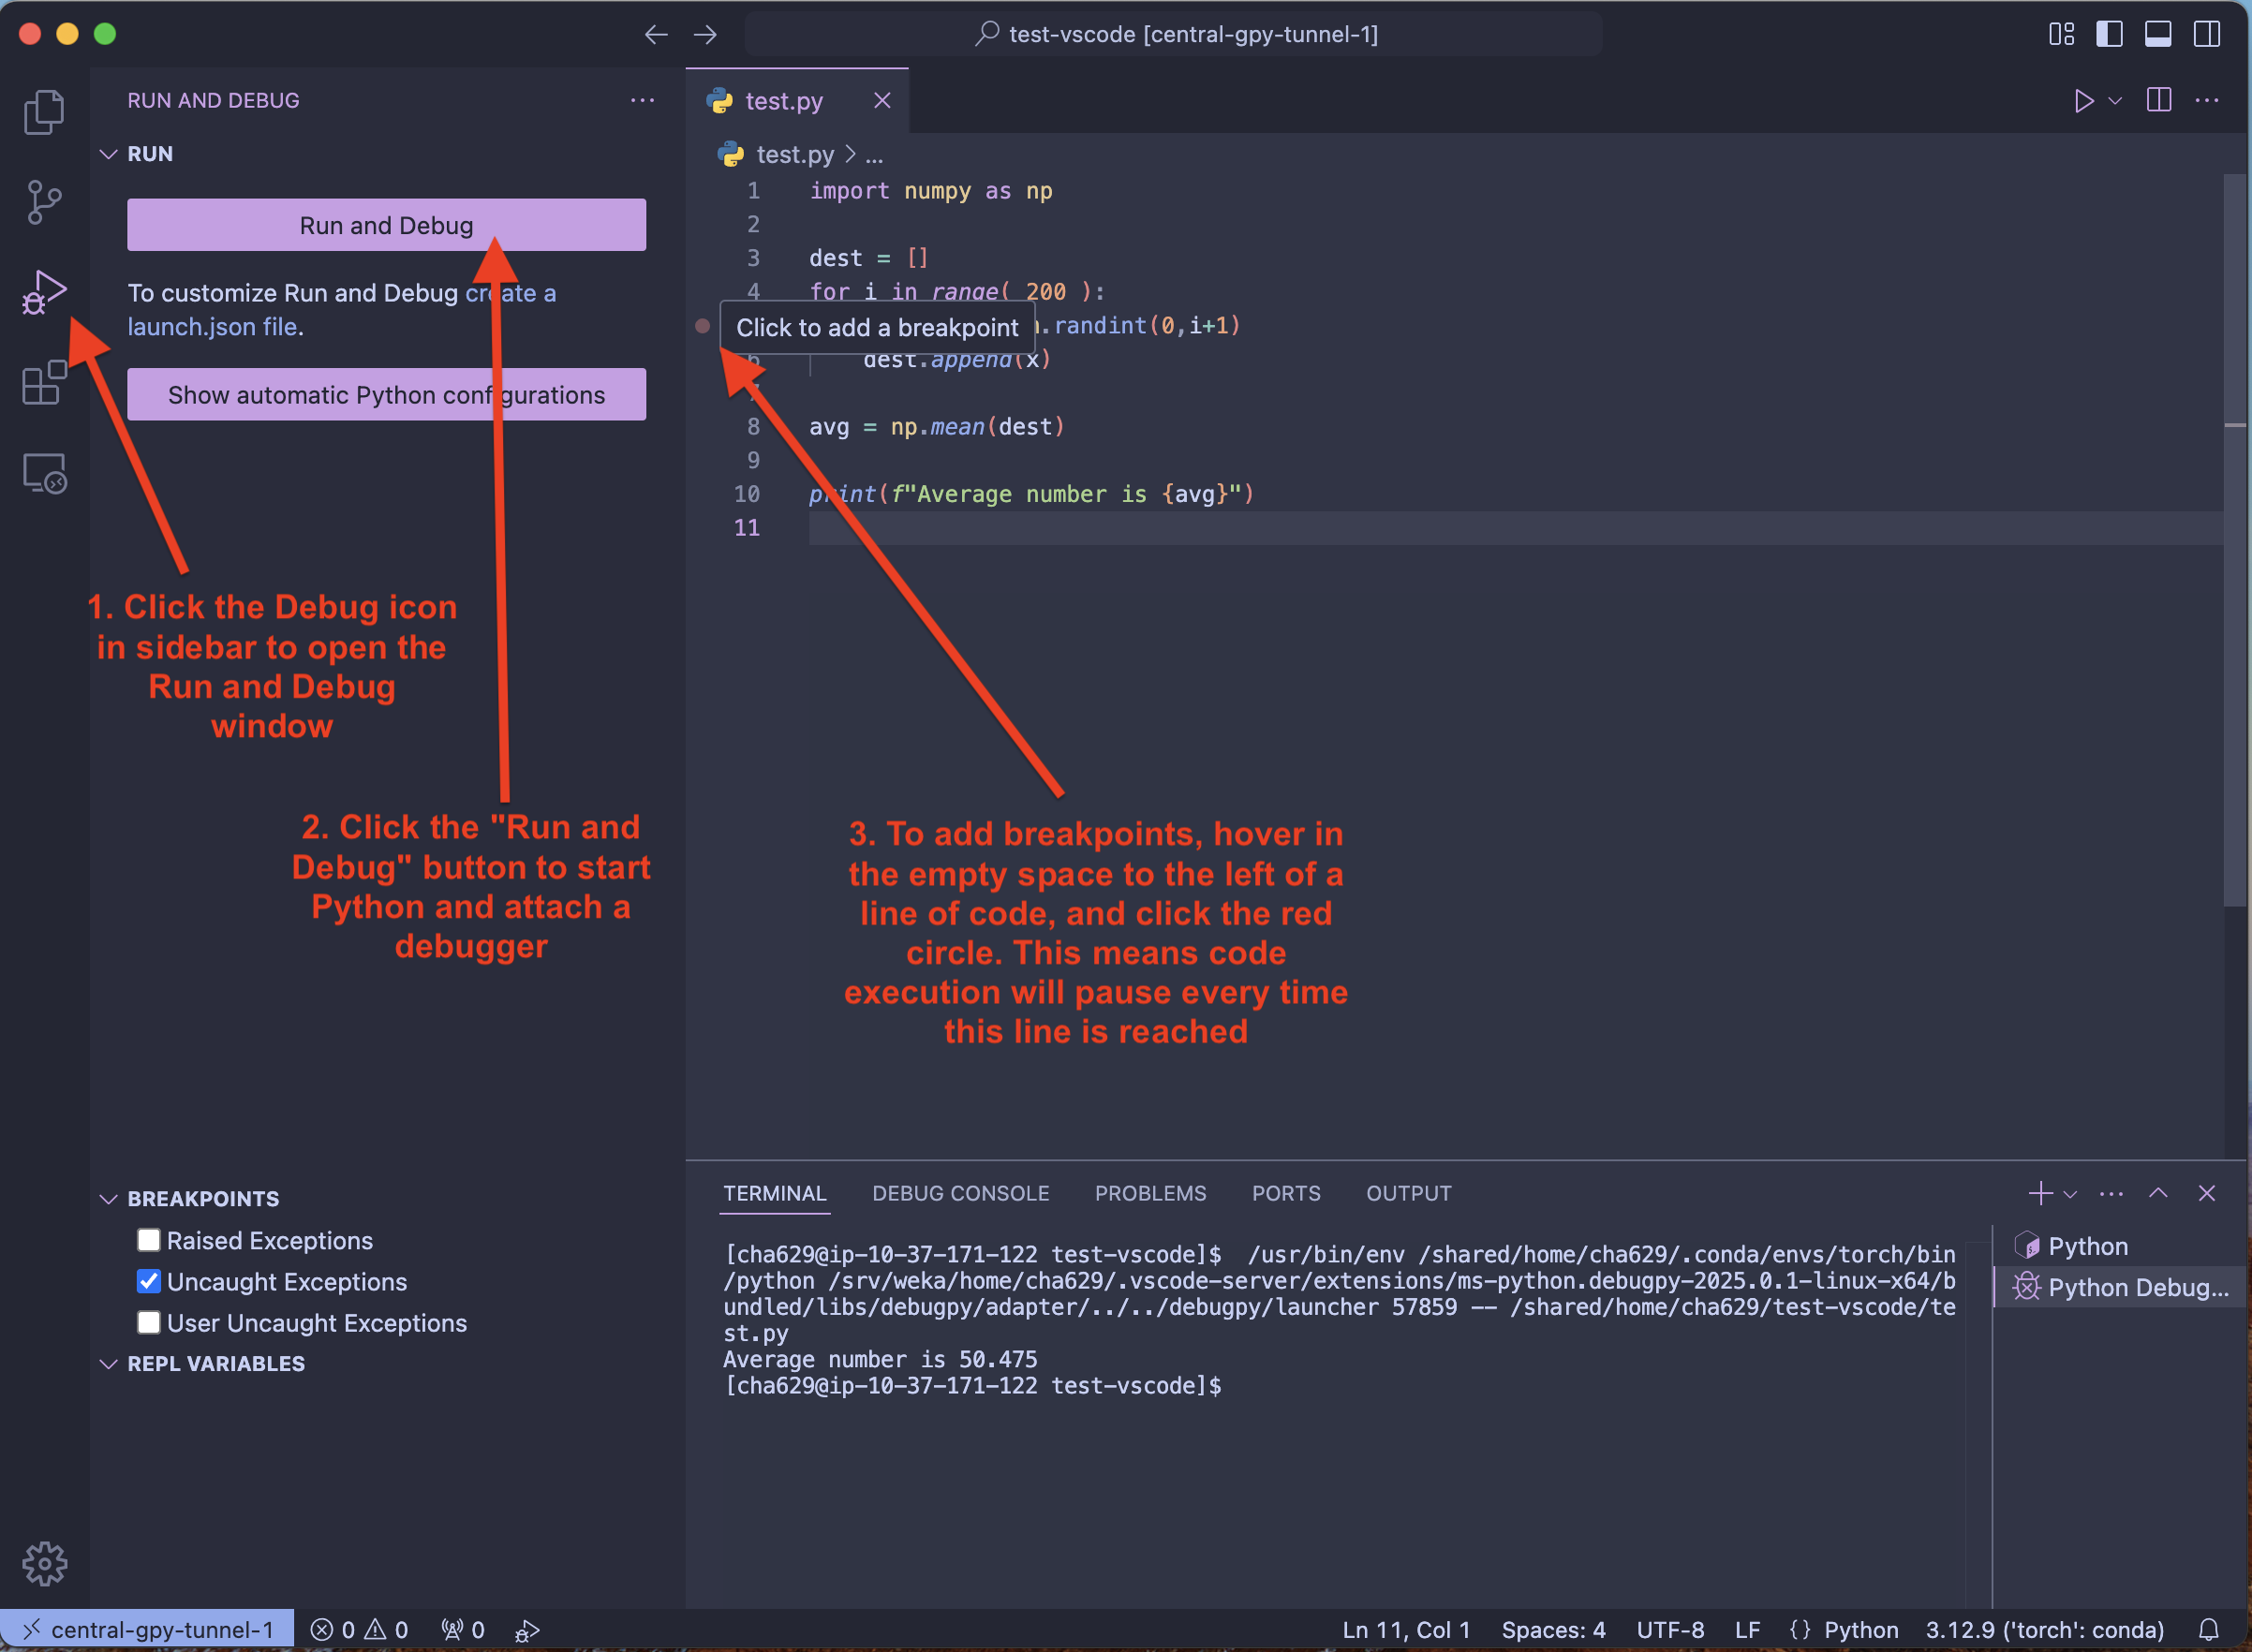
To start the debugger, click the Debug/Play icon on the left sidebar. This will open the Run and Debug window in the left pane.
To start the Python debugger, click the "Run and Debug" button. This will run the code as normally until a breakpoint line is reached and execution is paused. Once your code is paused, you can inspect and change variables, and step through execution one line at a time.
You can add breakpoints to individual lines by hoverying in the empty space to the left of the line, and clicking on the red circle that appears.
Adding breakpoints means that when Python is run in debug mode, code execution.
When execution is paused, you should see the following screen:
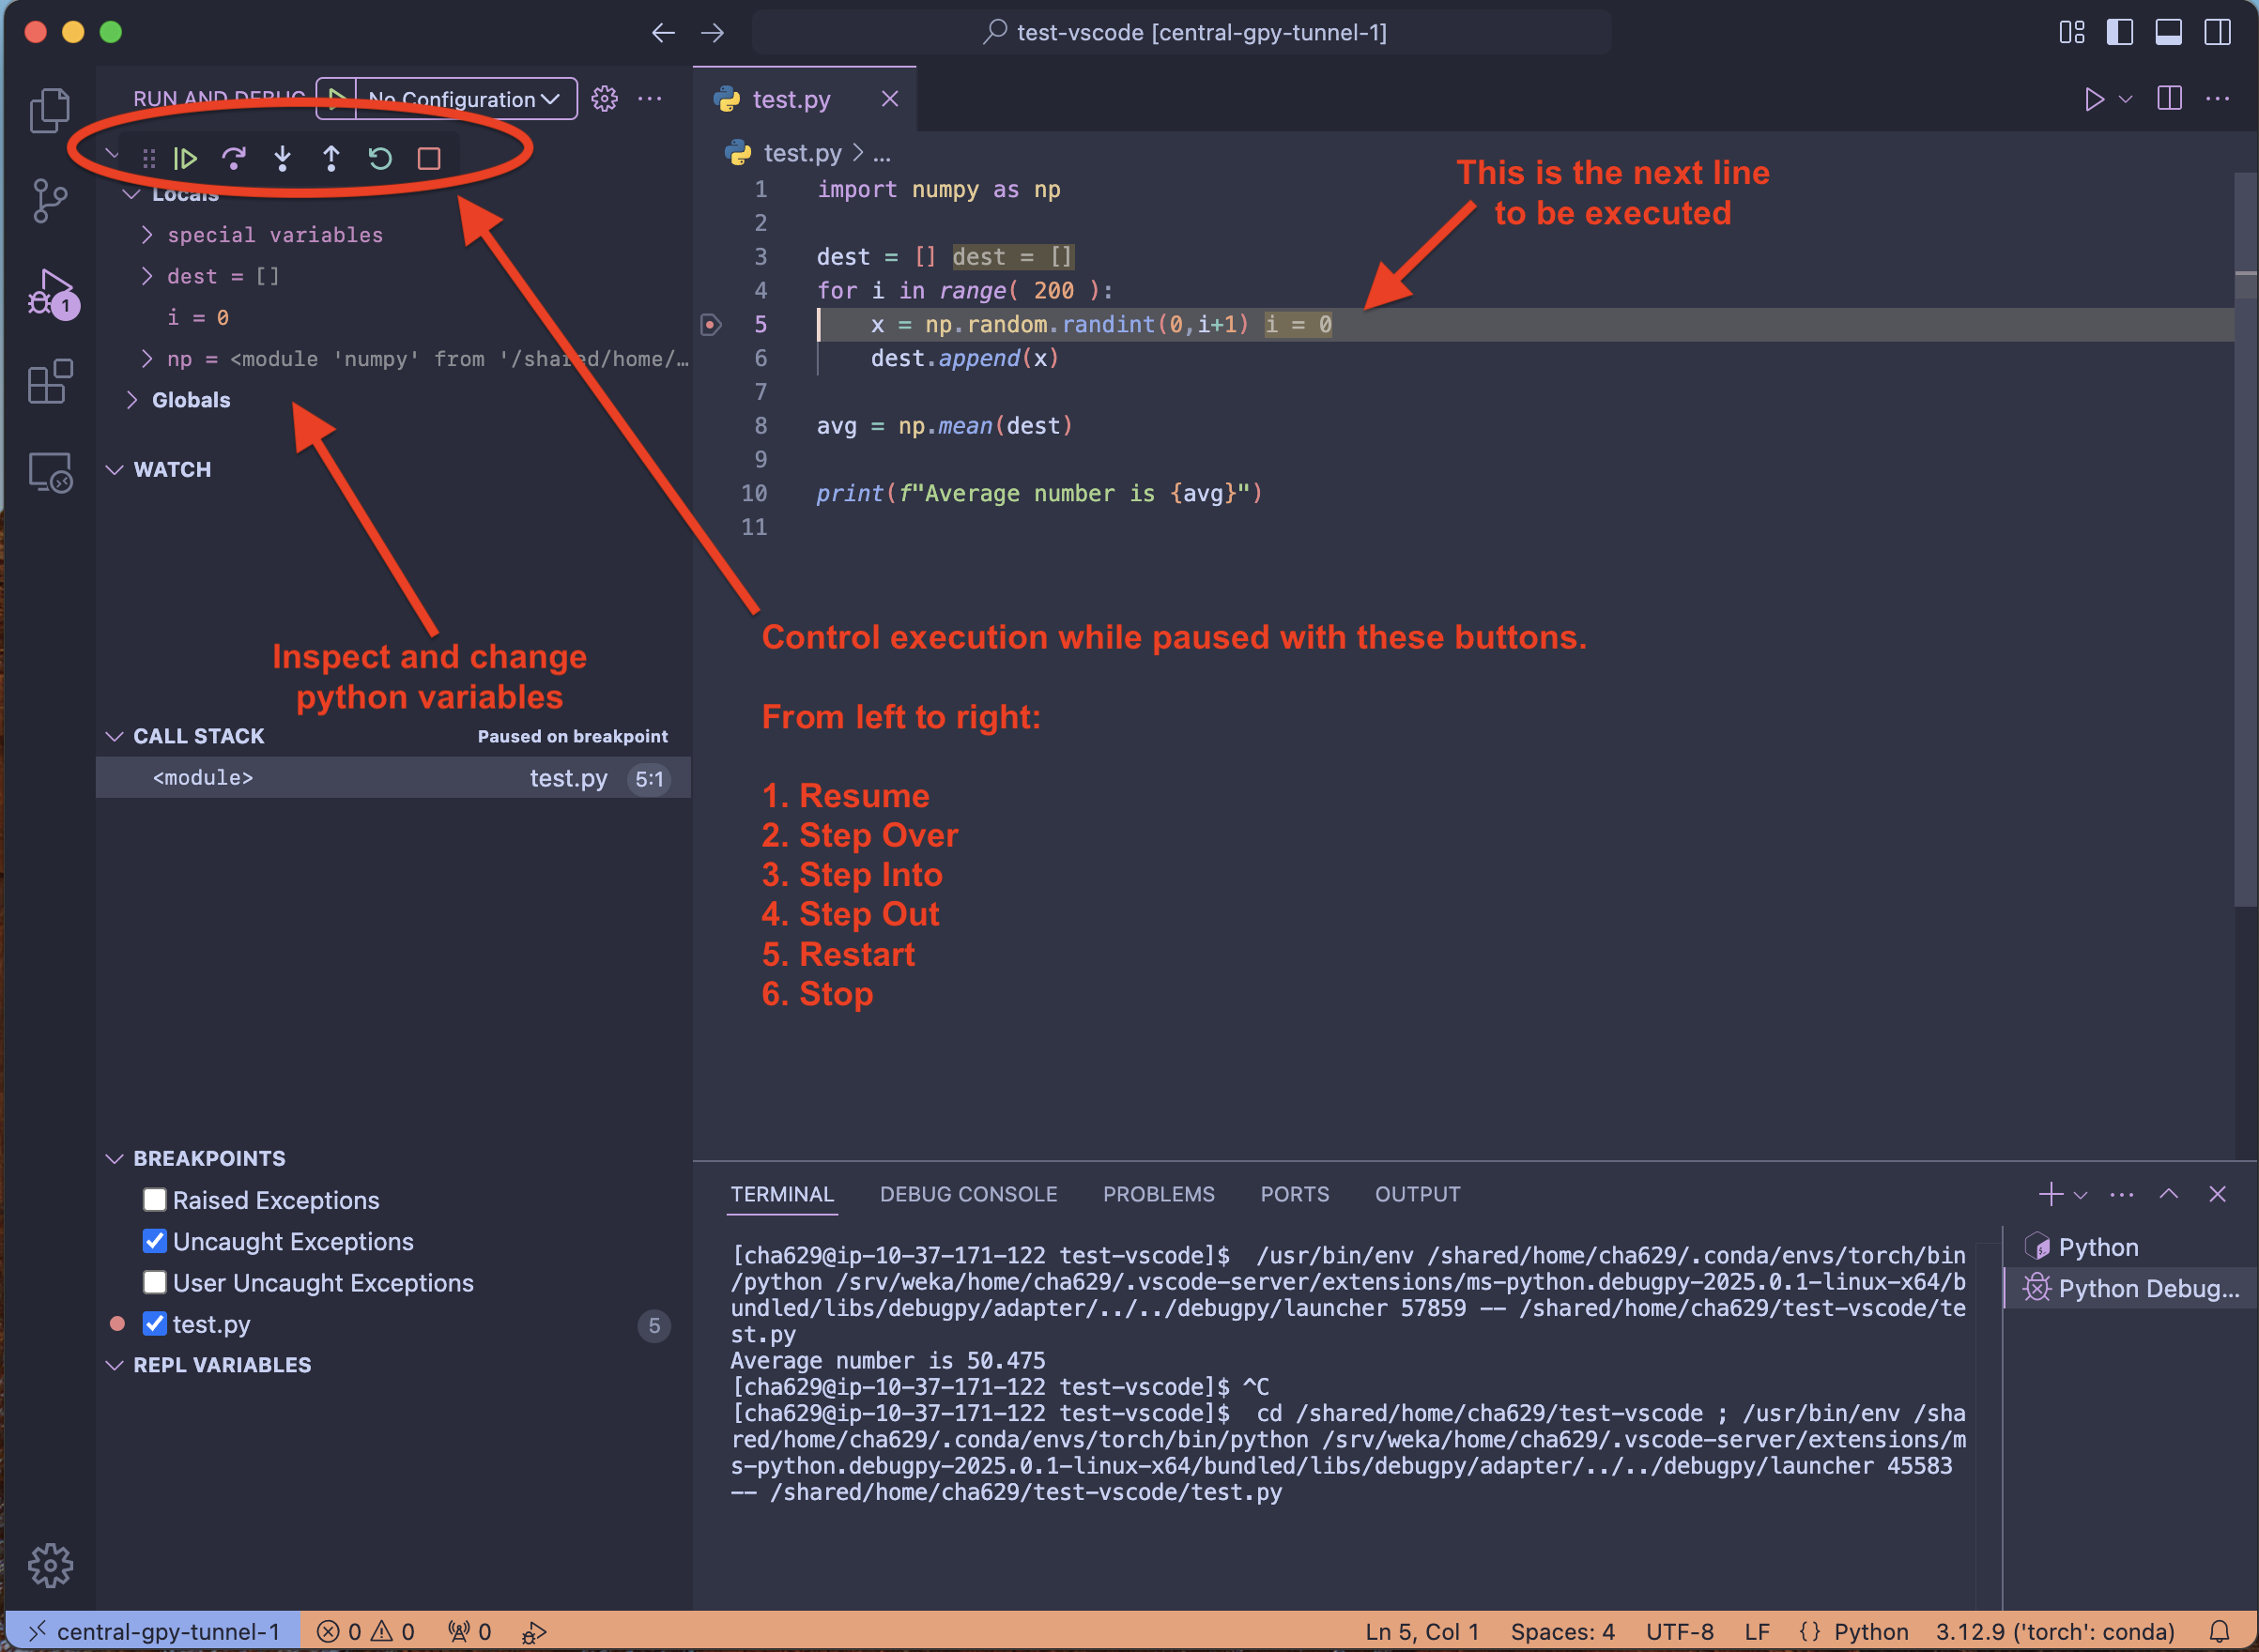
Current variables are listed on the left side. You can also add a watch instruction which lets you see the value of an aribtrary expression (e.g. x + 5).
You can control execution while paused with the debug toolbar at the top of the screen. The buttons are as follows:
- Resume Execution - continue executing the program as normal, until the next breakpoint
- Step Over - execute the next line of code, then pause execution. This treats function calls as a single line of code and will execute the entire function before returning.
- Step Into - execute the next line of code, then pause execution. This will step into a function and pause after the first line within the function, unlike Step Over.
- Step Out - resume execution and pause after the current function exits.
- Restart - restart the Python program
- Step - stop execution of the program without continuing
For more information on the Python debugger in VSCode, including debugger configurations and advanced setup, read the VSCode docs on Python debugging.